eco-1002 · Short-run output and interest
Aggregate Demand and Short-Run Supply (AD-AS)
How total spending and total production interact to determine the price level and output in the short run — and how a supply shock differs from a demand shock.
Learning objectives
- Sketch the AD-AS diagram and label the axes (price level vs output).
- Predict the effect on Y and P of a demand shock vs a supply shock.
- Identify a real-world example of each kind of shock from 2020-2025.
Why two shocks, two outcomes
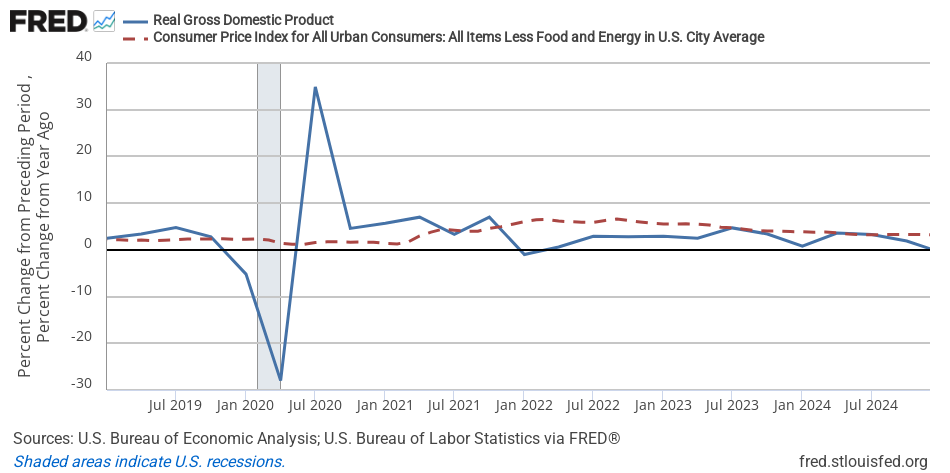
In March 2020, COVID lockdowns hit. Output collapsed. Prices barely budged for several months — in fact some prices fell. Then in 2022, oil prices spiked after Russia’s invasion of Ukraine, and gas at the pump rose 60%. Output didn’t collapse the same way — it slowed — but prices rose fast.
Two shocks, two very different outcomes for . AD-AS is the simplest model that explains why.
The two curves
Aggregate demand (AD) traces every combination where total spending equals total output. It’s downward-sloping in : when prices are higher, real money balances are smaller, the interest rate is higher (see IS-LM), and spending falls.
Short-run aggregate supply (SRAS) traces the price level firms will charge at each level of . Firms set prices based on expected prices and how stretched their cost structure is. SRAS slopes upward in : when output runs above the natural rate, costs (wages, raw materials) rise faster than expected, so firms raise prices.
The shocks, mapped
A demand shock moves AD without moving SRAS. Example: COVID lockdowns cut consumer spending and business investment sharply, so AD shifted left. Equilibrium output and price both fell.
A supply shock moves SRAS without moving AD. Example: the 2022 energy spike raised production costs at every level of output, so SRAS shifted up/left. Equilibrium output fell and price rose at the same time — the painful stagflation outcome.
The diagnostic: if and move in the same direction, it was a demand shock. If they move in opposite directions, it was a supply shock.
Play with it
Default calibration. AD and SRAS cross at Y ≈ Yn, P ≈ Pe.
Short-run AD-AS. AD slopes down in (Y, P); SRAS slopes up around Yₙ. Demand shocks shift AD; supply shocks change Pᵉ or Yₙ. Drag the AD or SRAS pill on the right edge, use sliders, or pick a preset.
Try three shocks:
- Fiscal expansion (slide G up). AD right ⇒ Y* up, P* up. Both move together — demand shock.
- Monetary expansion (slide M up). Same direction as fiscal.
- Cost-push shock (slide expected price up). SRAS up/left ⇒ Y* down, P* up. Opposite directions — supply shock.
What this tells us about policy
Demand shocks are relatively easy to respond to. The Fed (monetary) or Congress (fiscal) can push AD back the other way and restore the old equilibrium — at least roughly. Most recessions before 2020 were demand-shock recessions.
Supply shocks are harder. The textbook response — accept some output loss to keep inflation expectations anchored — was Volcker’s choice in 1980 and (in a milder form) the Fed’s choice in 2022-23. Trying to “fix” a supply shock by expanding demand just adds inflation on top of the cost-push inflation.
Take it next
The interactive isn’t fully realistic — real economies face both shocks at once, expectations adjust, and prices are sticky in asymmetric ways. But the qualitative diagnostic — “which direction did Y and P move?” — works on most macro news stories. Try it the next time the GDP report comes out.