eco-1002 · Inflation and unemployment
Okun's Law and the Output–Inflation Chain
Linking the output gap to unemployment via Okun's law, then to inflation via the Phillips curve — the short-run macro chain in one picture.
Learning objectives
- State Okun's law and apply it to predict unemployment from an output gap.
- Combine Okun's law with the expectations-augmented Phillips curve.
- Use the combined chain to explain the 2020-2022 US macro path.
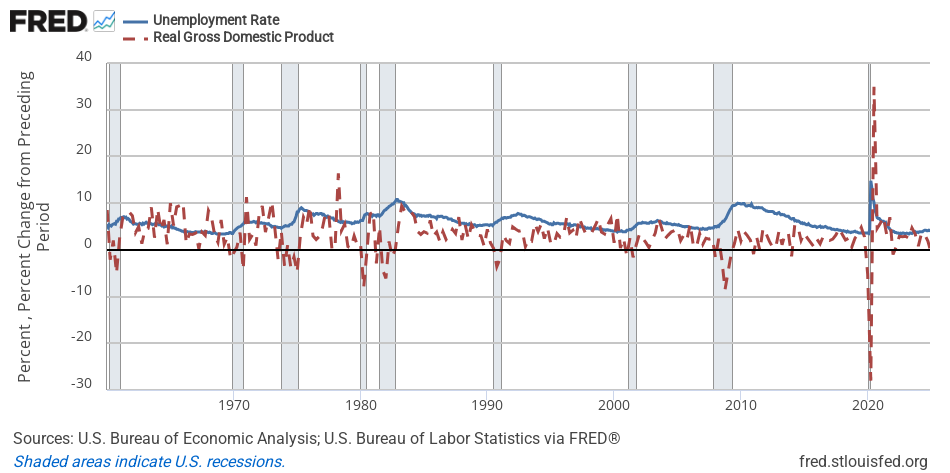
Okun’s law
Output and unemployment move together over the business cycle. The empirical regularity, due to Arthur Okun:
with for the US (each percentage-point of output gap corresponds to about half a percentage-point change in unemployment in the opposite direction). When output runs above its natural level, firms hire more; when below, they lay off.
The Phillips curve, again
The expectations-augmented Phillips curve:
Low unemployment relative to the natural rate pushes inflation above expectations. Conversely high unemployment pulls inflation down.
Stringing them together
Chaining Okun and Phillips, an output gap directly produces an inflation response:
The product is the sacrifice ratio’s inverse: roughly how much extra inflation a percentage point of over-heating output produces in the short run.
Okun: gap → unemployment
Phillips: unemployment → inflation
Positive output gap (boom) ⇒ lower unemployment via Okun ⇒ higher inflation via the Phillips curve. Try sliding the output gap from −3% to +3% — that's roughly the swing the US economy made between the 2020 trough and the 2022 over-heating.
The 2020-2022 US path
Try sliding the output gap from −3% (the 2020 trough) up through +2% (the 2022 over-heating) and watch the chain:
- Output collapses (gap = −3%) ⇒ unemployment spikes (Okun) ⇒ inflation falls toward expectations.
- Stimulus + recovery push the gap to +2% by mid-2022 ⇒ unemployment falls to ~3.5% (well below the natural rate) ⇒ inflation overshoots expectations dramatically.
- Aggressive Fed tightening through 2023 closes the gap back toward zero ⇒ unemployment normalizes ⇒ inflation eases toward target.
The framework doesn’t tell you why the gap moved — supply shocks, fiscal stimulus, monetary loosening, and post-pandemic re-opening all contributed. But once you know the gap, Okun + Phillips give you a rough prediction of unemployment and inflation.