eco-1002 · Inflation and unemployment
The Phillips Curve: Inflation vs Unemployment
Why low unemployment tends to come with high inflation in the short run — and why that trade-off vanishes in the long run once people's expectations catch up.
Learning objectives
- Describe the short-run trade-off between unemployment and inflation.
- Explain why the long-run Phillips curve is vertical at the natural rate.
- Cite the 2022 inflation episode as an example of expectations risk.
The original observation
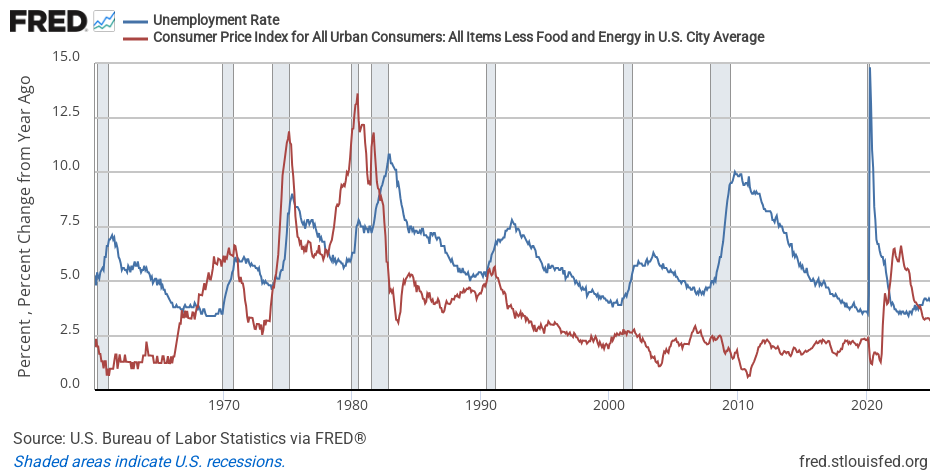
In 1958 the economist A.W. Phillips plotted UK wage growth against unemployment from 1861 to 1957 and noticed a clear negative relationship: when unemployment was low, wages (and prices) rose faster. Policymakers in the 1960s took this as a menu — pick the combination of unemployment and inflation you want and pursue policies that get you there.
That worked for about a decade. Then in the 1970s, inflation rose sharply while unemployment was high. The simple Phillips trade-off seemed to have broken. What went wrong?
Expectations
The fix is the expectations-augmented Phillips curve:
In words: inflation equals what people expect inflation to be () plus a short-run kick from the unemployment gap . If unemployment is below the natural rate, firms compete for scarce workers, wages rise faster than expected, prices rise faster than expected, runs hot.
But over time, catches up. People are not stupid; if inflation has been running at 6% for three years, they start expecting 6%. The whole Phillips curve shifts up. To keep unemployment below the natural rate you’d need ever-faster surprise inflation — and once people figure that out, you can’t surprise them anymore.
That’s why in the long run the Phillips curve is vertical at . There is no permanent trade-off; the only sustainable unemployment rate is the natural one.
Play with it
Pin a low unemployment rate. Slowly raise the expected-inflation slider and watch the curve drift up. Today’s actual inflation moves with it. That’s the textbook story of the 1970s — sustained low unemployment unanchored expectations, and inflation kept ratcheting up.
The 2022 episode
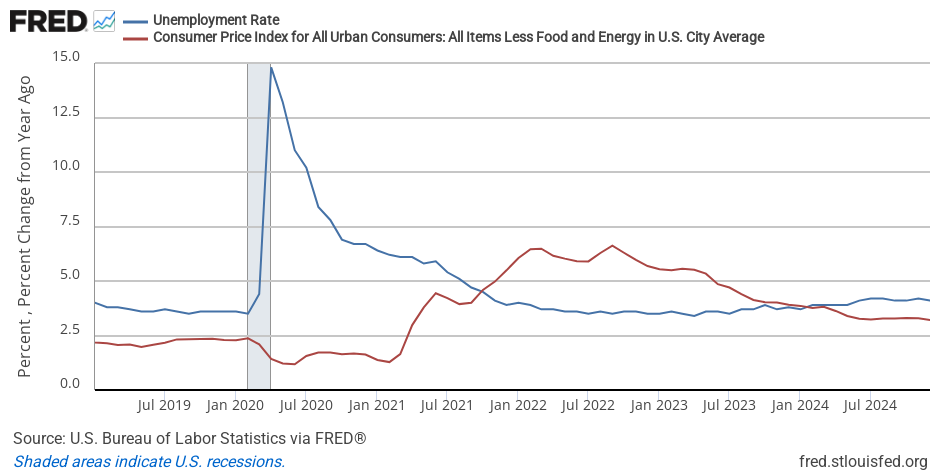
When US inflation hit 9% in mid-2022, the question on every policymaker’s mind was: have expectations come unanchored, the way they did in the 1970s? Survey measures of rose somewhat but stayed well below 9%. Bond markets’ implied stayed near 2.5%. The Fed bet that expectations were still anchored and tightened aggressively to bring actual inflation back down — which it did, without unemployment spiking.
That’s the textbook soft landing. It worked partly because the Phillips-curve framework gives policymakers a clear test: watch expectations, not just realized inflation.
A modest takeaway
In the short run there’s a real trade-off. Stimulating an economy that’s already at full employment pushes inflation up; cooling an overheated economy raises unemployment. In the long run, neither policy can buy permanently lower unemployment — only better matching of workers to jobs (training, labor-market reform) moves the natural rate itself.