fin-3610 · Time, money, and interest rates
Bond Pricing and Yield to Maturity
Pricing coupon and zero-coupon bonds as the PV of their cash flows; defining YTM as the IRR of a bond; the price-yield curve, duration, and convexity.
Learning objectives
- Price a coupon bond given coupon rate, face value, maturity, and YTM.
- Compute YTM given a bond's price.
- Use modified duration to approximate price changes from yield changes.
A bond is just an annuity plus a lump sum
A standard coupon bond has three numbers:
- Face value (also called par or principal), typically $1,!000 for US corporates.
- Coupon rate (annual rate, paid as semiannually in the US; we’ll use annual coupons here for simplicity).
- Maturity years.
It pays each year for years, plus at maturity. Its price is the PV of those cash flows at the yield to maturity :
The first term is a coupon annuity; the second is a lump-sum face value. Both formulas you’ve already seen.
YTM = IRR of a bond
The yield to maturity is the single discount rate that makes the bond’s PV equal to its current market price. It’s the bond investor’s IRR if held to maturity, assuming all coupons are reinvested at .
Given a price, you solve for , usually iteratively, or with a spreadsheet’s RATE function.
Three regimes
| Coupon vs YTM | Price vs Face | Name |
|---|---|---|
| trading at a premium | ||
| trading at par | ||
| trading at a discount |
A bond issued at par at a 5% coupon, then yields rise to 7%: the price falls below par. Why would anyone pay par for a 5% coupon when the market wants 7%? They wouldn’t. So the price drops to make the total return (coupons + capital gain at maturity) equal 7%.
Play with it
Trading at par because coupon = YTM. Anchor for comparison.
Price-yield curve is convex. For a small yield change Δy, price changes by approximately −D_modified · P · Δy. Longer maturity → steeper curve → more interest-rate risk. Drag the YTM pill on the right, type values, or pick a preset (Treasury, IG corp, junk, T-bill).
Three things to confirm:
- Price-yield is downward-sloping and convex. As yield rises, price falls, at a decreasing rate (the convexity).
- Longer maturity = steeper curve. A 30-year bond’s price is far more sensitive to yield changes than a 2-year bond’s.
- Zero-coupon bonds are the most sensitive of all. Toggle the “zero-coupon” checkbox and watch the curve get even steeper: 100% of the cash flow comes at maturity, so duration equals maturity.
Duration: how price-sensitive
Two duration concepts you should know:
Macaulay duration is the weighted-average time until you receive the bond’s cash flows, with weights equal to each cash flow’s share of the bond’s total PV:
Modified duration is the one that’s actually useful for risk management. It estimates the percentage price change for a small yield change:
Example. A 10-year bond at 5% YTM with a 5% coupon has Macaulay duration ≈ 8.1 years and modified duration ≈ 7.7. If yields jump 50 bps (from 5% to 5.5%), the bond price falls by approximately .
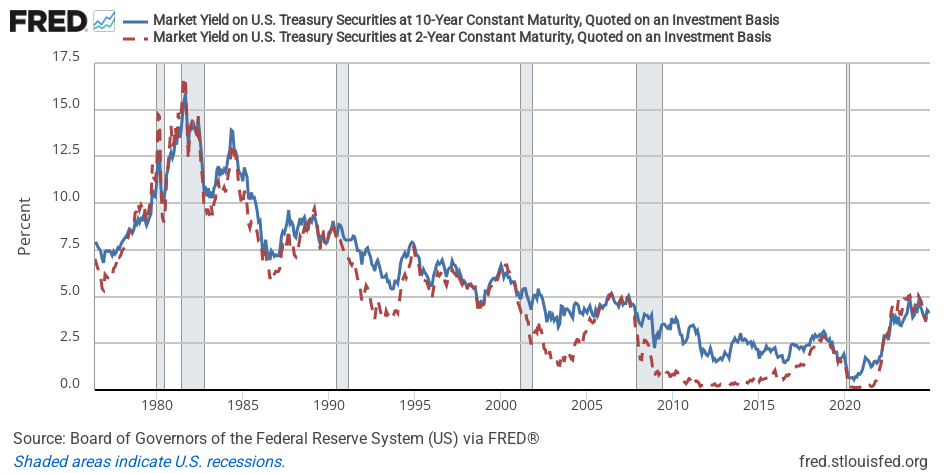
This is the interest-rate risk banks and bond funds manage every day. Silicon Valley Bank’s failure in 2023 was largely a duration mismatch story: they held long-duration bonds and Treasuries, and when yields spiked in 2022-2023, the mark-to-market value of those holdings fell sharply, eroding their capital.
Why convexity matters
Modified duration is a linear approximation. For small yield moves it’s accurate; for large moves, the price-yield curve is visibly bent, so the linear approximation under-estimates how much price falls when yields rise and how much it gains when yields fall. The bend is convexity, and it’s a positive thing for the bondholder: they benefit asymmetrically.
For most coursework you can treat convexity as a second-order correction; for real-world risk management of large portfolios, it’s material.
Spreads come next
So far we’ve assumed a single risk-free yield . Corporate bonds trade at higher yields than Treasuries: the difference is the credit spread, which compensates for default risk. That’s the subject of the next lesson.