fin-3610 · Time, money, and interest rates
Interest Rates and the Term Structure
APR vs effective annual rate (and why credit-card disclosures hide the difference), the Fisher equation linking nominal and real rates, and what the shape of the yield curve tells you about the economy.
Learning objectives
- Convert between APR and EAR for any compounding frequency.
- Apply the Fisher equation to distinguish nominal from real interest rates.
- Interpret the yield curve's slope and the meaning of inversion.
APR vs EAR: the same number stated three ways
The same loan can have three different “interest rates” depending on the quoting convention:
- APR (Annual Percentage Rate): the stated nominal annual rate. It does not account for intra-year compounding.
- EAR (Effective Annual Rate): the actual annual return after intra-year compounding. This is what your money actually experiences.
- APY (Annual Percentage Yield): identical to EAR; the term banks use on deposit products by law.
If a credit card quotes 24% APR with monthly compounding, the EAR is:
The general formula: with compoundings per year at APR rate :
As (continuous compounding), EAR , which is the absolute ceiling.
| APR | (annual) | (monthly) | (daily) | continuous |
|---|---|---|---|---|
| 5% | 5.000% | 5.116% | 5.127% | 5.127% |
| 12% | 12.000% | 12.683% | 12.747% | 12.750% |
| 24% | 24.000% | 26.824% | 27.115% | 27.125% |
Note how the gap widens at higher rates. This is why the federal Truth in Lending Act requires lenders to disclose APR (so you can compare across products) while requiring deposits to be quoted as APY (so they can’t make a competitor’s higher headline rate look better via a sneakier compounding frequency).
Nominal vs real: the Fisher equation
When prices in the economy rise at rate (inflation), a nominal return of corresponds to a smaller real return . The exact Fisher equation:
For small rates, the approximation is fine. In 2022 with US inflation at 9% and Treasury yields around 4%, real returns on cash were negative, a saver lost purchasing power even though their nominal balance grew.
This is also the right way to think about Social Security COLAs, union contracts, and mortgage rates: a nominal rate without a companion inflation forecast tells you very little about real purchasing power over the life of the contract.
The yield curve
If you plot the yield on US Treasury securities against their maturity (3 months, 6 months, 1 year, 2 years, 5 years, 10 years, 30 years), you get the yield curve. Most of the time it slopes upward: longer-maturity bonds yield more.
Three reasons:
- Term premium. Investors demand extra return to lock up money for longer (uncertainty about future inflation, rate moves).
- Expectations of future rates. If markets expect the Fed to raise rates, long yields exceed short yields.
- Liquidity preference. Long bonds are harder to sell quickly without a price hit.
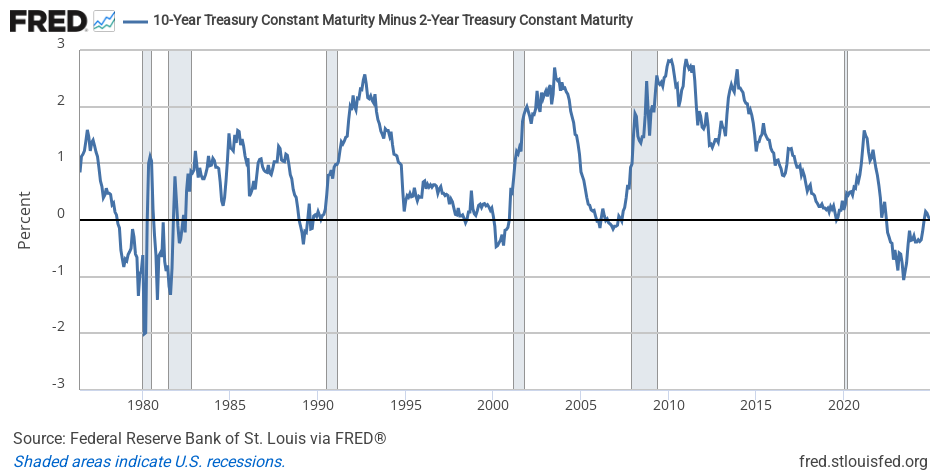
When the curve inverts (short rates above long rates), it’s historically signaled a recession within 6-18 months. The mechanism: the Fed has tightened policy aggressively (pushing short rates up), and markets see slower growth ahead (long-term inflation and growth expectations drop, pulling long rates down). The yield curve was deeply inverted from mid-2022 through mid-2024 ahead of the soft landing.
Reading current US rates
A quick map for orientation (US, mid-2026 levels):
- Federal funds rate: target set by the Fed, currently about 4%.
- 3-month Treasury bill: ~4%.
- 2-year Treasury note: ~3.8%.
- 10-year Treasury note: ~4.2%.
- 30-year Treasury bond: ~4.5%.
- 30-year fixed mortgage: ~6.5% (a spread above 10y Treasury for credit + prepayment risk + servicing).
- High-yield corporate bond index: ~7.5% (a wider spread reflecting default risk).
These rates move; pull FRED series DGS10, MORTGAGE30US, and
BAMLH0A0HYM2 for today’s numbers.
Why this matters for valuation
Every DCF you run in this course uses a discount rate. That discount rate should reflect (a) the appropriate Treasury yield for the horizon of the cash flows and (b) a risk premium on top of it. The yield curve gives you (a) directly. Unit 4 will show you how to estimate (b).
For a 5-year corporate cash flow, you don’t discount with the overnight rate. Match the horizon of the rate to the horizon of the cash flow.